700.000.000$ !
That’s the amount of online sales Amazon made on Black Friday in 2015.
Now imagine the impact, if their website was down for only 1 min…
You think this never happens, right?
Well, In 2013 Amazon website was down during 43 minutes due to a server outage…costing the company around 4,72 million in sales loss!
Apple, AliExpress or even other major players in e-commerce, none of them are free from a server outage. Unfortunately, it is often too late when you realize that your website suffers from downtime.
Whether you’re the head of an e-commerce store or a marketing manager, this article will help you to set-up an optimal monitoring strategy for insuring your site’s reliability and avoiding a downtime nightmare during holiday season.
Behold, the summary of the main topics:
Why should you monitor your e-commerce site
5 monitoring tips to get your site ready
[alert type=”success” icon-size=”hide-icon”] ⏱ Estimated reading time: 10 min 52 [/alert]
E-commerce key events
Holiday season which includes Black Friday, Christmas and winter sales (for European countries) are important if not vital for online retailers. Actually, a large share of the annual turnover is generated exactly at this period of the year.
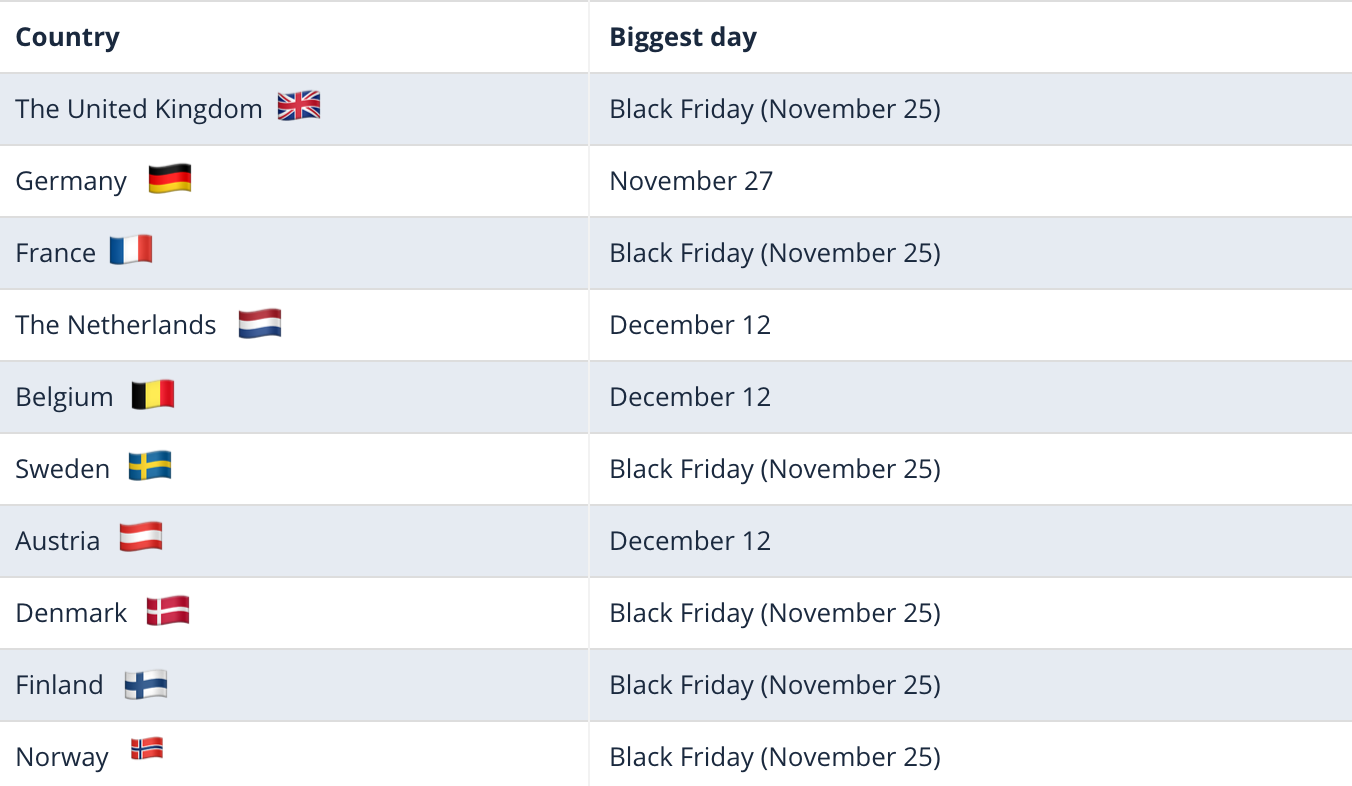
There is no “one best day” worldwide as it depends on the consumer behaviours from each country. While the U.S or U.K online retailers will see a massive peak during the cyber week, it would be different for Belgium and France.
Indeed, most of them will purchase online right before Christmas and “January Sales”.
The below board includes the biggest days for online shopping in Europe in 2015.
 Source: E-commerce News Europe
According to Adobe’s prediction, the 2017 holiday season will be the first to break $100 billion in online sales (in the U.S). They’ve actually created a specific landing page on which you can see the results.
They’ve made a similar analysis (back in 2016), where we can notice that the online shopping stats are slightly different from the U.S market. Here is the stats by country in Europe.
Search trends during holiday season
On Google
A growing number of people go online, looking for special deals that they might not get from “brick and mortar” retailers. It’s specifically at this period of the year that the web traffic is booming.
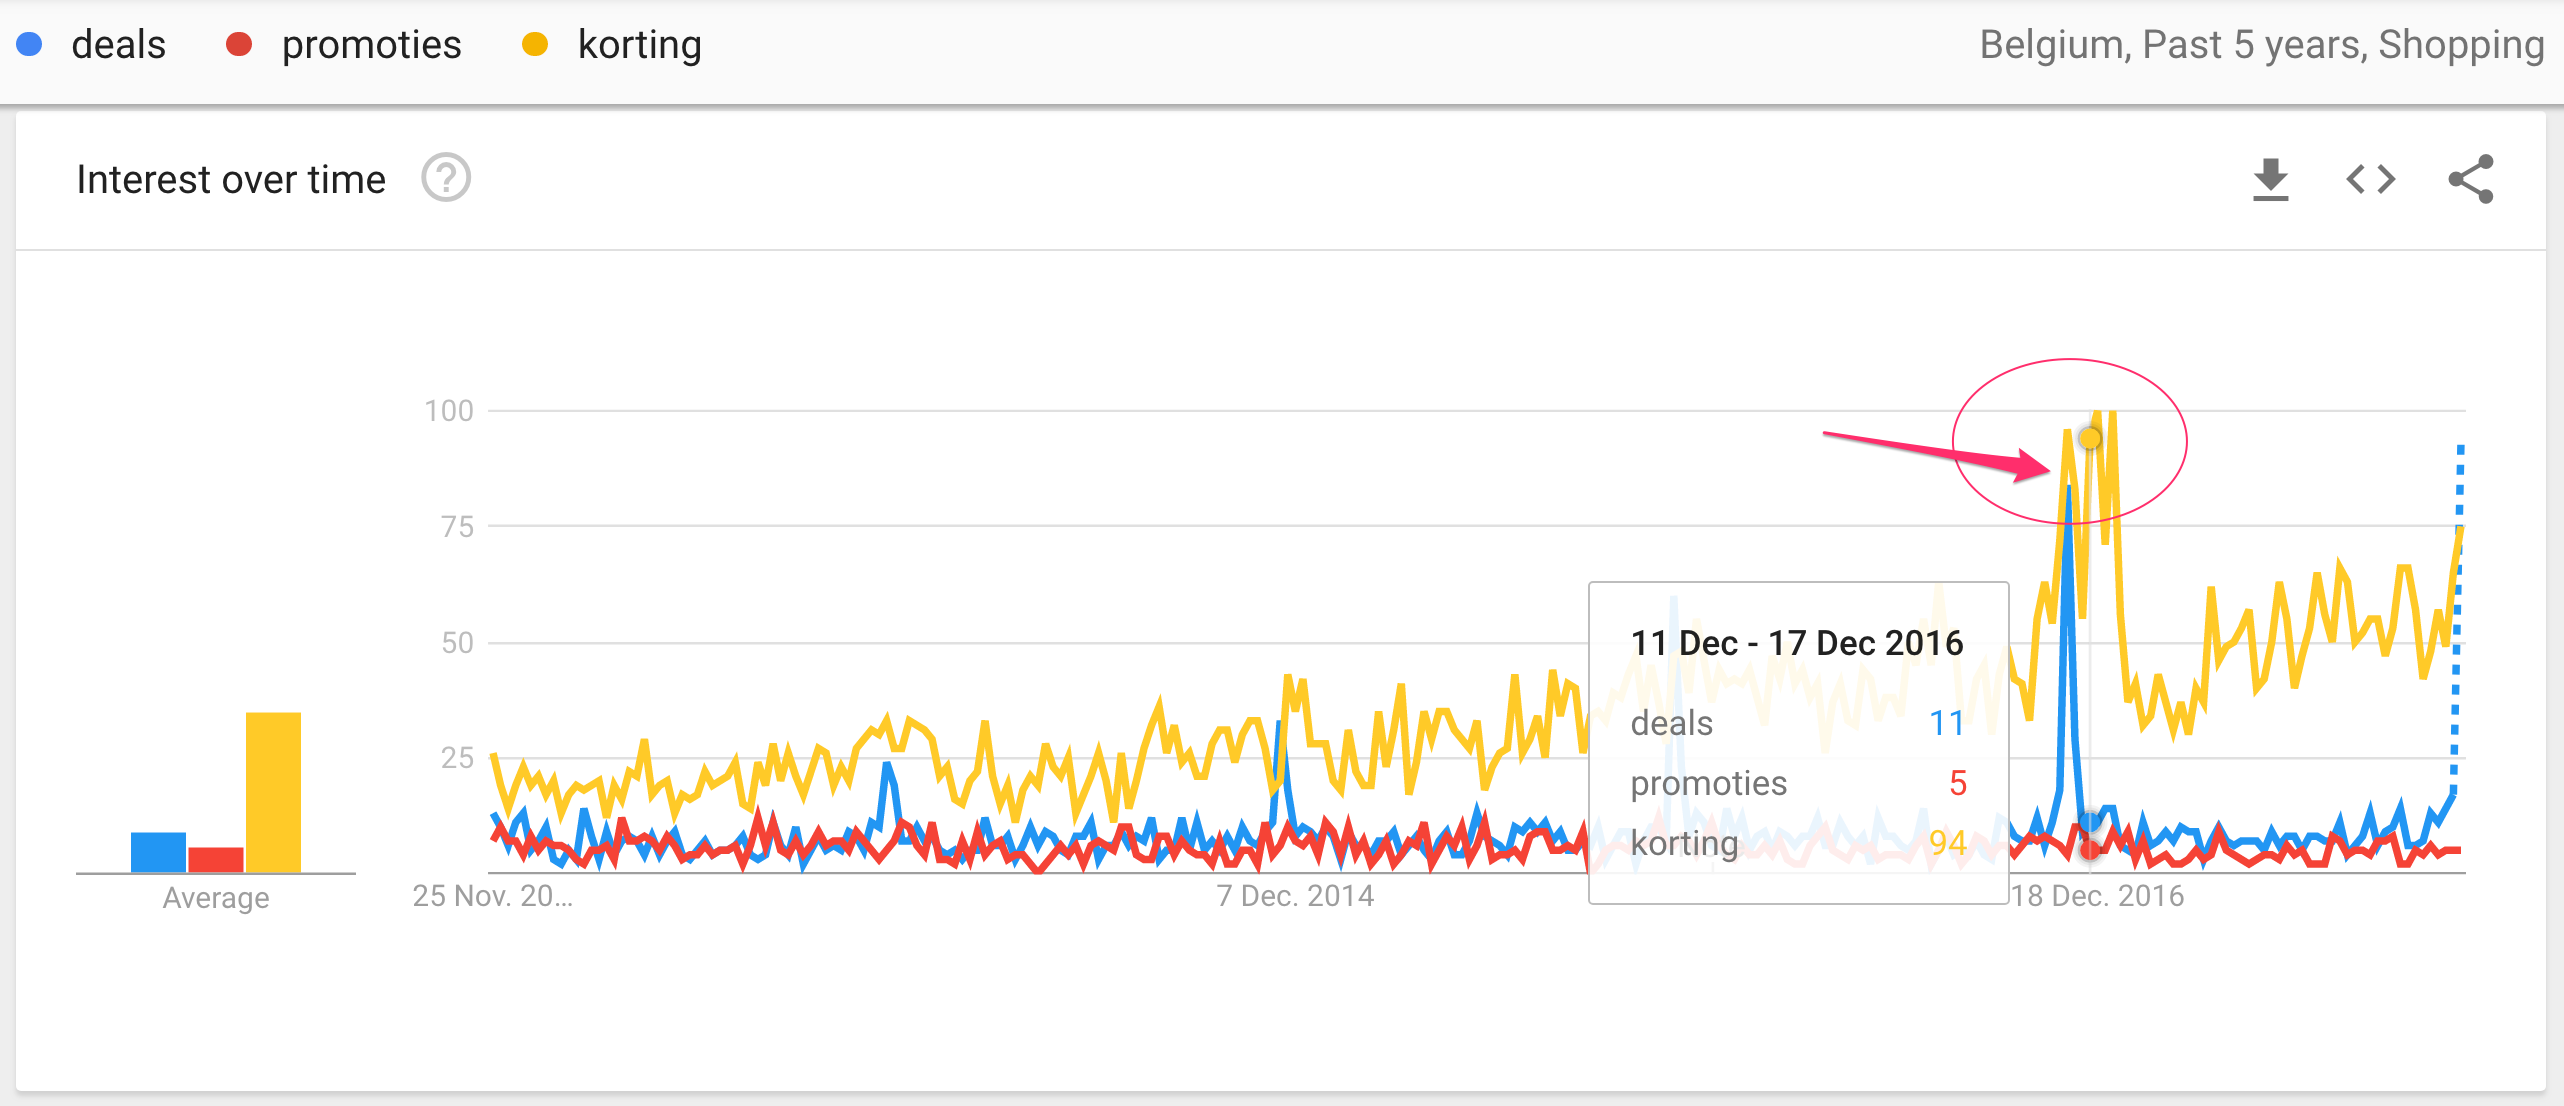
When looking at the search trends made on Google (past 5 years in Belgium) for the queries such as “promotions” or “deals, there is clearly an important peak between mid-November to early January.
Again, the queries tend to vary from one country to another. For instance, the trends is a bit different at the worldwide level.
Source: Search result for related terms to “deals” on Google Trends in Belgium
Shopping sites traffic
Similar web released an interesting graphic regarding the sites traffic trends when it comes to holiday season for online retailers. Eventhough it is specific to the U.K market, shopping sites see their traffic going crazy one week prior to Black Friday (24 Millions) as well as during Christmas.
Why should you monitor your e-commerce website?
Every year it’s the same story.
You set-up acquisition strategies by investing massively in Adwords and Facebook ads, you make sure that the email campaign is optimized and ready to be sent to your customers on the D day…
Well, you basically apply every best practices seen on kissmetrics to bring as much traffic as possible to boost your sales!
And yet, you forgot 1 element.
Something you don’t expect to happen but which could ruin all of your efforts.
This thing is called… “DOWNTIME”!
Still not sure what that means?
Every time your website is down, it’s just like if your store was just closed. Your customers can’t access to it and even less buy from you. At that moment, you start freaking out because you’re losing money!
The direct consequences of downtime
- ROI impact on your marketing campaigns
- Lower turnover
- Loss of credibility – Brand image
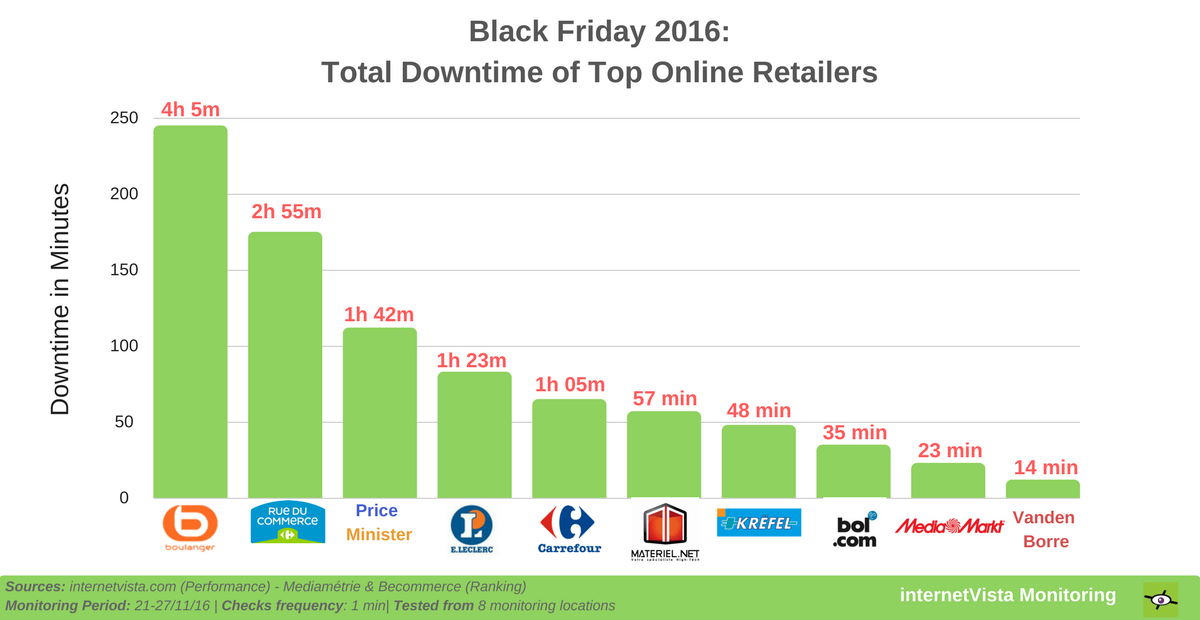
In 2016, the biggest online retailers in Belgium and France, such as Bol.com or Mediamarkt, were down for a total of 12 hours only during the black friday week!
How to calculate the impact of downtime on your ecommerce?
To realize how big an outage can affect your online revenues, you need to make a simple calcul. The only things you need to have are:
- Your turnover (monthly/annually)
- Your website uptime (start your free trial here to monitor it)
Methodology: Turnover * (100 – uptime rate)
Let’s take an example to illustrate that:
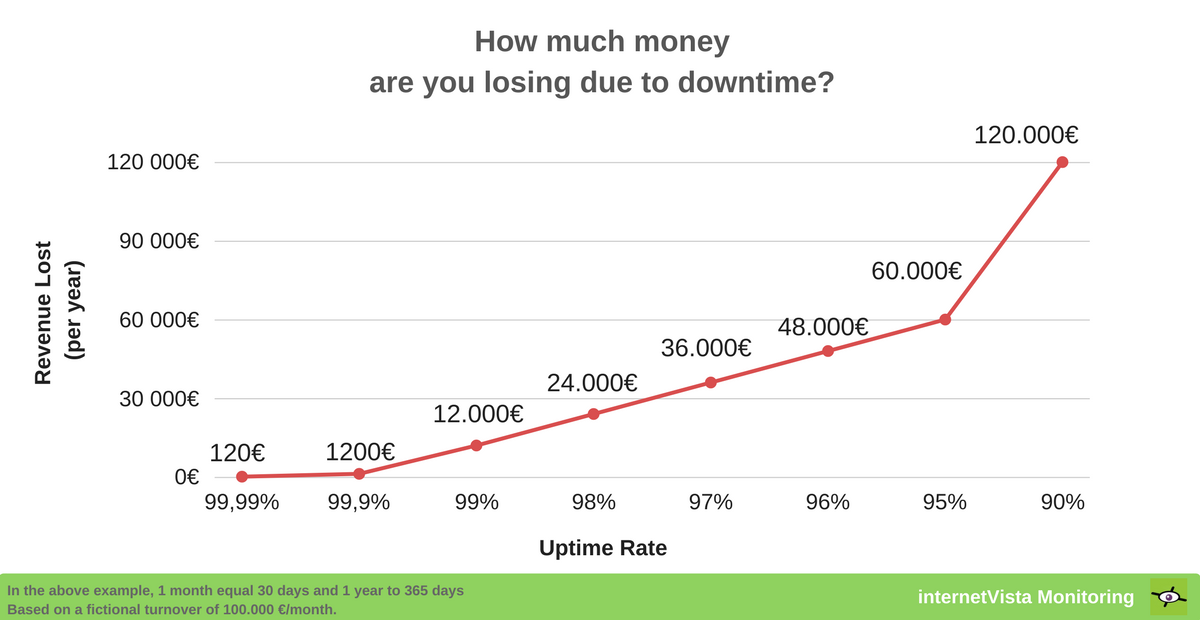
Imagine that your online store has an uptime rate of 99% and make 100K € of sales per month.
Calcul: 100.000 * (100-99%)= 1000€/month.
Convert it to a year and you potentially losing 12.000 € per year!
The below graphic help you to visualize the cost of downtime on a yearly basis.
5 monitoring tips to get your e-commerce site ready
There is no point in monitoring all the page on your website. What you need to do on the other hand is, to monitor your most important elements in order to be alerted as soon as they are not available.
Here is the question you should ask yourself: What are your most important pages?
If you’re not sure, check your account in Google Analytics by filtering the “Unique Visitors” or the “transactions” (Behaviors > Landing pages)
Our 5 monitoring tips you should apply today:
Tip #1: Verify the content on your homepage
Tip #2: Monitor your landing pages
Tip #3: Avoid a broken or non-functioning checkout
Tip #4: Secure your database from hackers
Bonus: Optimize your conversion funnel with a transaction monitoring
Tip #1: Verify the content on your homepage
Type of monitoring: Website 🖥
Putting your homepage on monitoring is pretty much the basics. In fact, it it’s not available, you’ll lose almost 90% of your traffic because this page is literally the point of entry for your customers.
Use a “matching sentence” and make sure your main keyword remains available by monitoring words like “Black Friday”, “Online deals” which should logically be present on your site during the holiday season.
This trick will allow you to be alerted as soon as your content disappears from your site. This can happen after your web dev team made a new release or simply when content has been hacked. This is known as website defacement.
🔎 URL to monitor: mysite.com
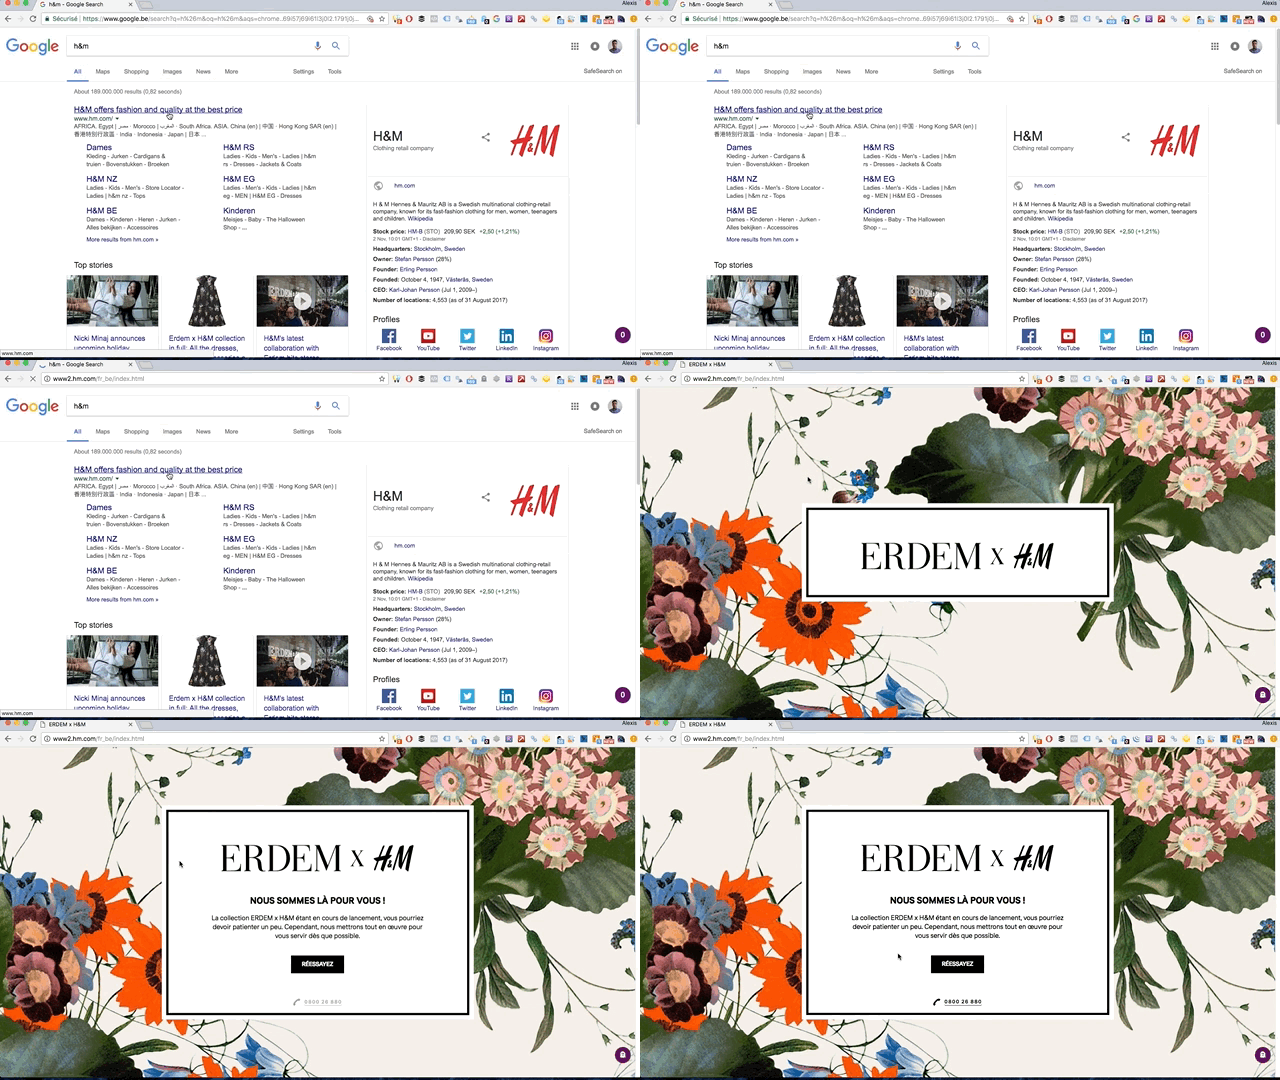
Source: H&M homepage was down during 2 hours on 31/10/17
💡 Pro tip: Make sure to keep track of your marketing campaigns by monitoring your tracking code (Google Analytics, Adwords, Fb pixel, …) and be alerted as soon as they disappear from your site.
Insert your Analytics ID in “matching sentence”
Tip #2: Monitor your landing pages
Type of monitoring: website 🖥
In Adwords, the higher your “Quality Score”, the more likely your ads will appear.
One of the factors taken into account to estimate your ads quality is the “landing page experience” which also depends on the its loading time. The faster your page load, the higher your landing page will be ranked.
But every time your landing page is down:
- Your CPC increase
- Your Quality Score decrease
- You’re wasting money
To get the most out of your marketing ROI, you should be monitoring your landing pages!
This will help you to directly be aware when an error is detected. If the outage takes more time to be fixed, make sure to put your Adwords campaigns in “Pause”. This way, you’ll avoid throwing money out the window because Google will keep charging you anyway!
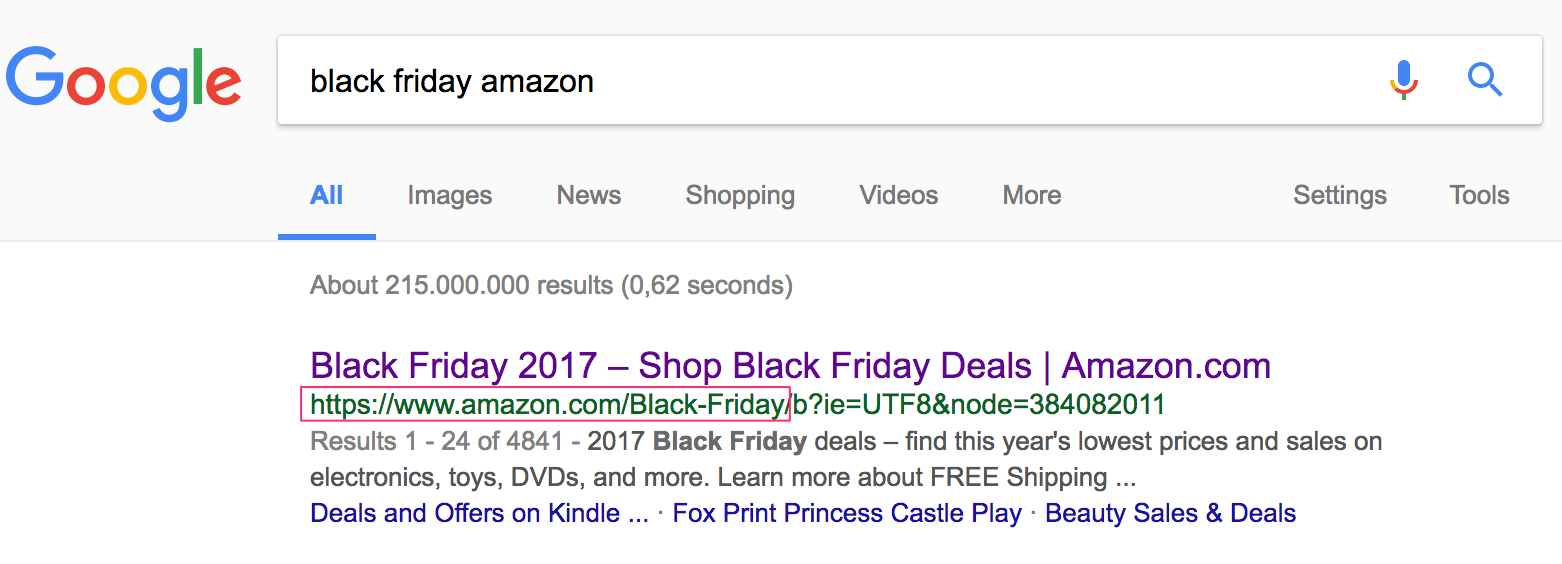
🔎 URL(s) to monitor: mysite.com/black-friday-2017 – mysite.com/christmas-deals
Source: Google SERP for Amazon
💡 Pro tip: List all of your most popular pages and make sure to put them under monitoring.
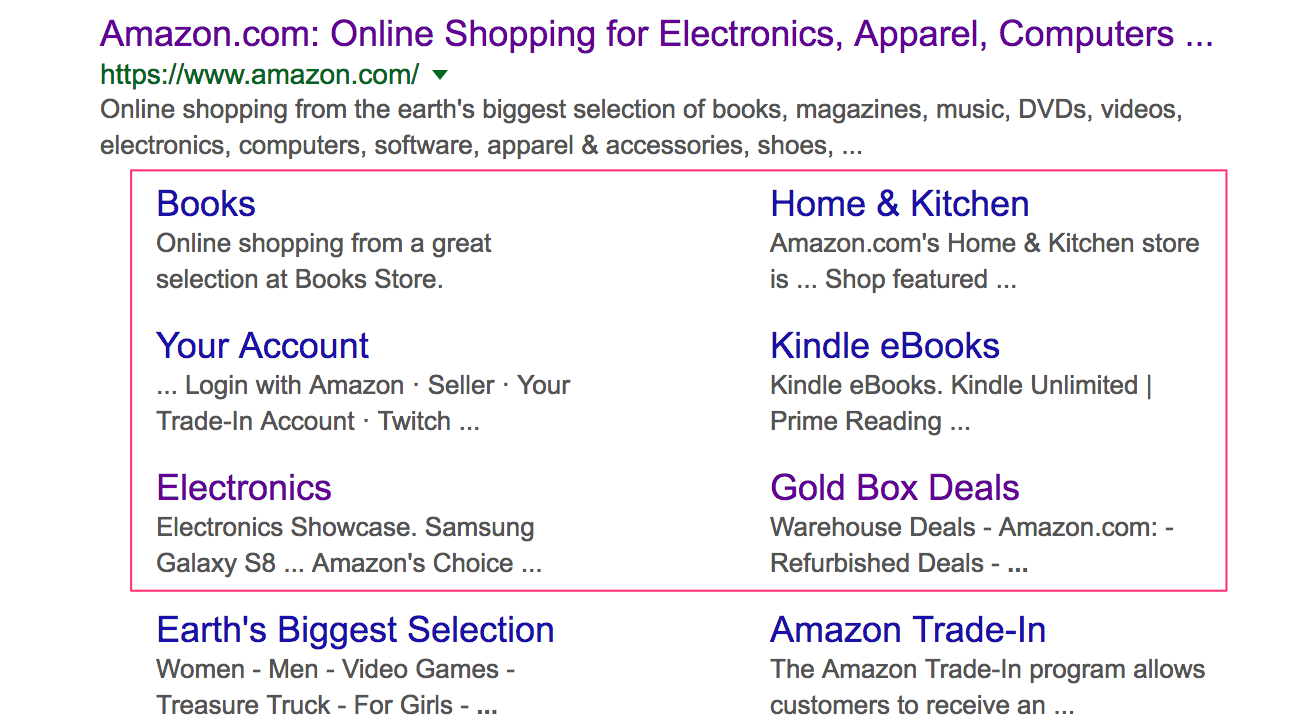
If I was in charge of Amazon’s website, I’d make sure to monitor the “sitelinks”. Even if those links are randomly generated in the Google SERP, they still represent the most popular/visited pages on your website. So you want to make sure that they remain available at any time!
Source: Google SERP for Amazon
Tip #3: Avoid a broken or non-functioning checkout
Type of monitoring: website/ web scenarios 🎥
Shopping cart abandonment are clearly one of the biggest challenge for the online retailers. According to 37 studies containing e-commerce statistics, the average checkout abandonment rate is 69,23%!
But that’s when your site is working properly, the rate could increase even more if your checkout page is down. In this case, a 300€ sales is the same as 25€.
A broken checkout will directly affect your sales… and your customers experience!
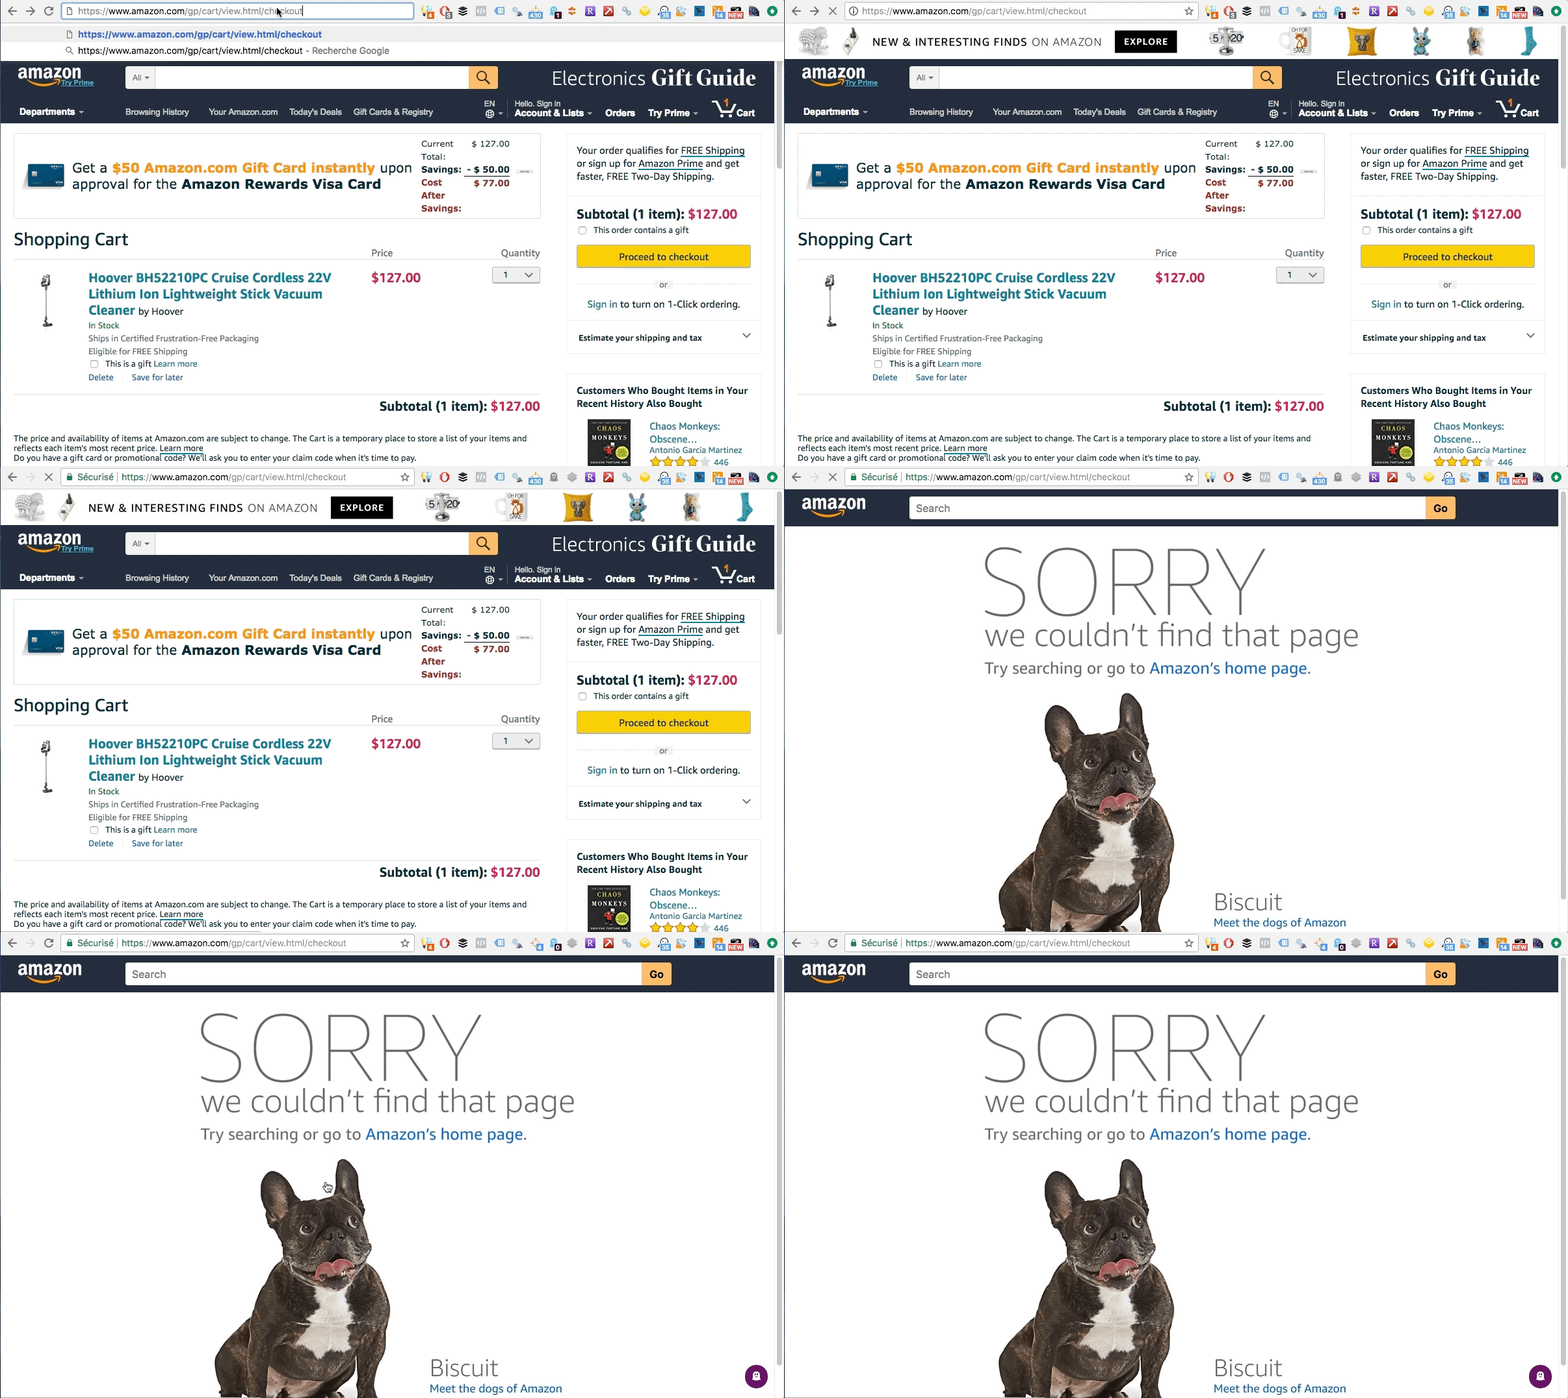
In the GIF below, we’ve tried to demonstrate the frustration that your customer could feel when trying to proceed his order confirmation. Note that, this is an example and never occurred on Amazon’s website (or at least not when we recorded the GIF).
In fact, they’ve created a dedicated page explaining how to proceed to checkout.
🔎 URL to monitor: mysite.com/checkout
Source: video capture of Amazon’s checkout
Tip #4: Secure your database from hackers
Type of monitoring: Services (MySQL database) 💾
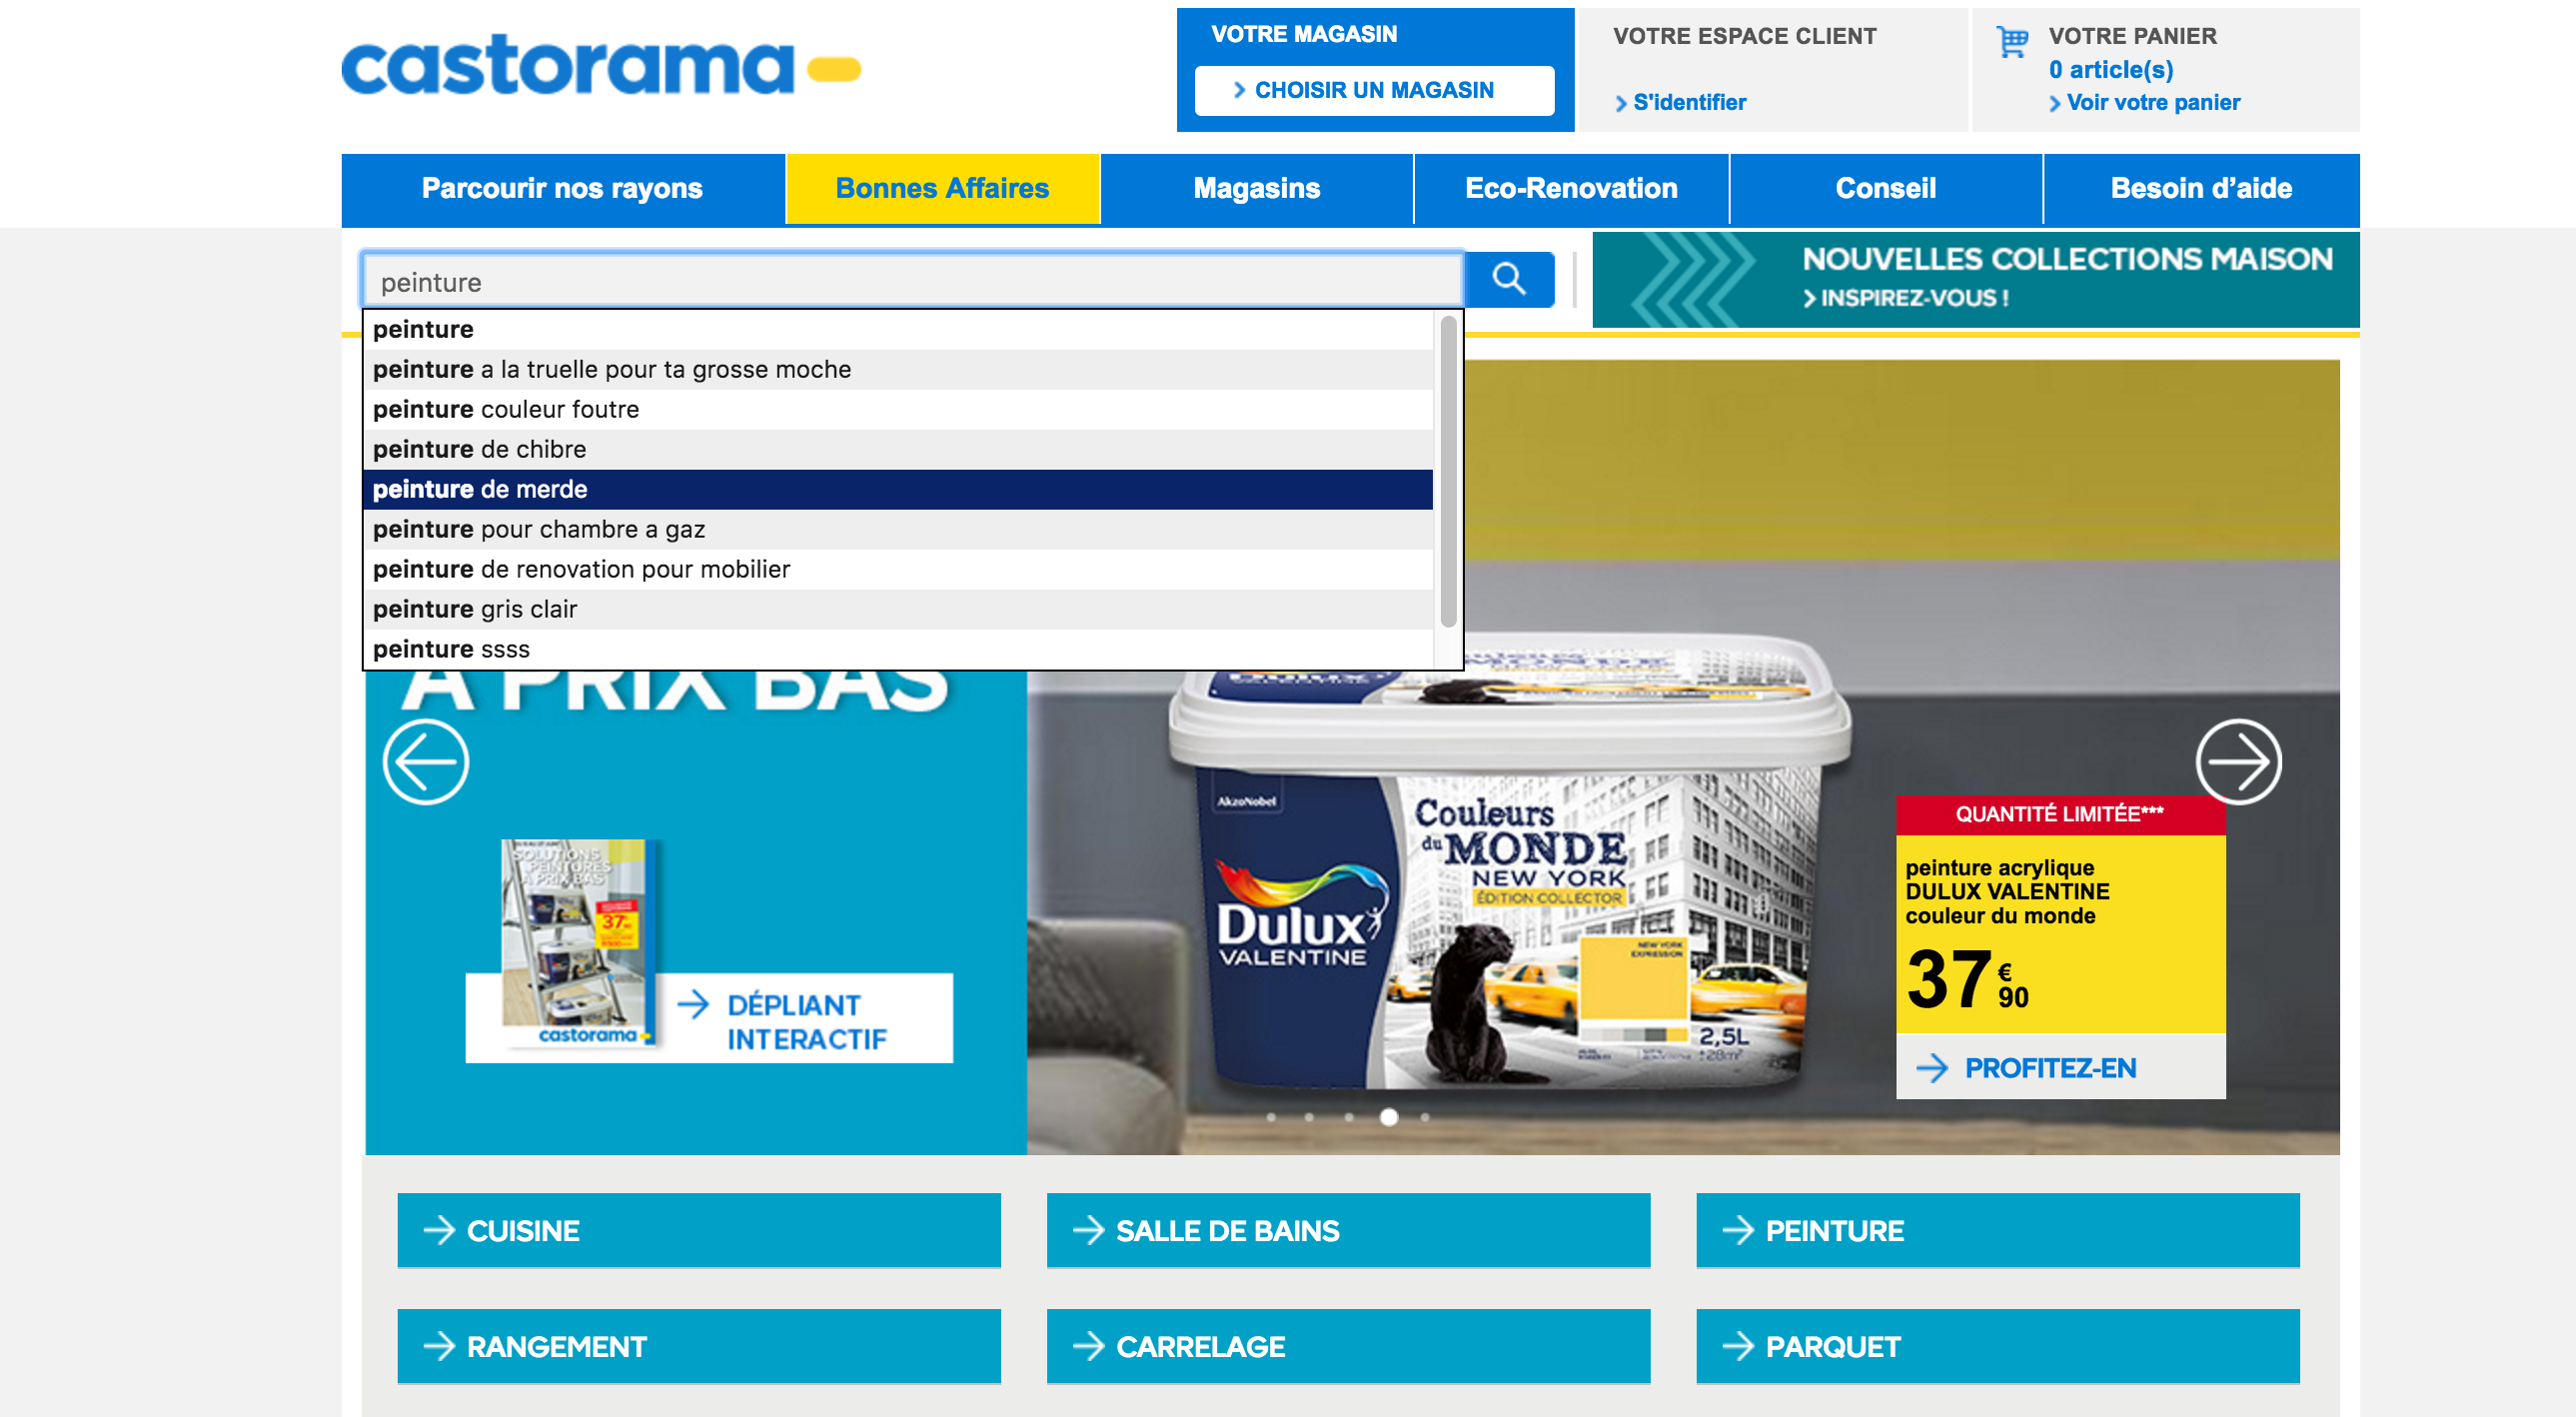
In 2016, Castorama (French DYI goods) website has been hacked. To be more precise, its search engine had been manipulated by some miscreants.
Result?
The site search function suggested some nasty and surprising results such as “screwdriver blonde”, “hammer to kill” or “saw to cut a body”. Some of them even included anti-Semitic messages when searching for “ovens” or “showers”.
Source: Screenshot of Castorama’s search results on 09/06/16
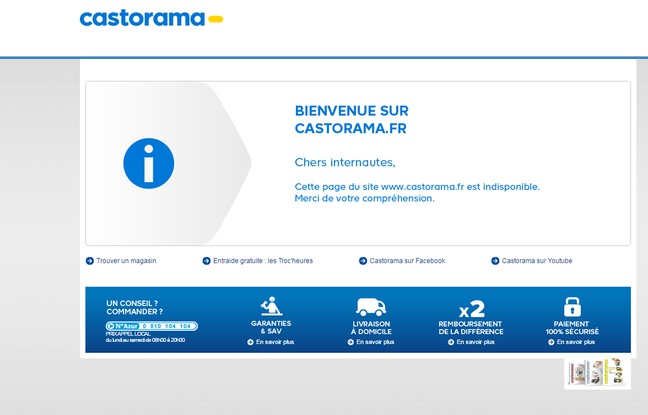
As soon as the database manipulation had been noticed, they decided to pull the website offline and was displayed as temporarily down for the users. But it took them a few hours before being aware of the situation thanks to screencaptures made by users through Twitter.
The website was back to normal but the whole situation lasted 6 hours!
This could had been quickly solved if they had monitored their database. They’d had been alerted as soon as an error (manipulation in this case) was detected.
Tip #5: Test your web form
Type of monitoring: website/ web scenarios 🎥
In order to avoid as much friction as possible, the user identification usually happens when a user wants to proceed to checkout.
But imagine, if during the login process, your web form is down?
Yep, you got it right… ONCE AGAIN you’ve just missed a sales opportunity!
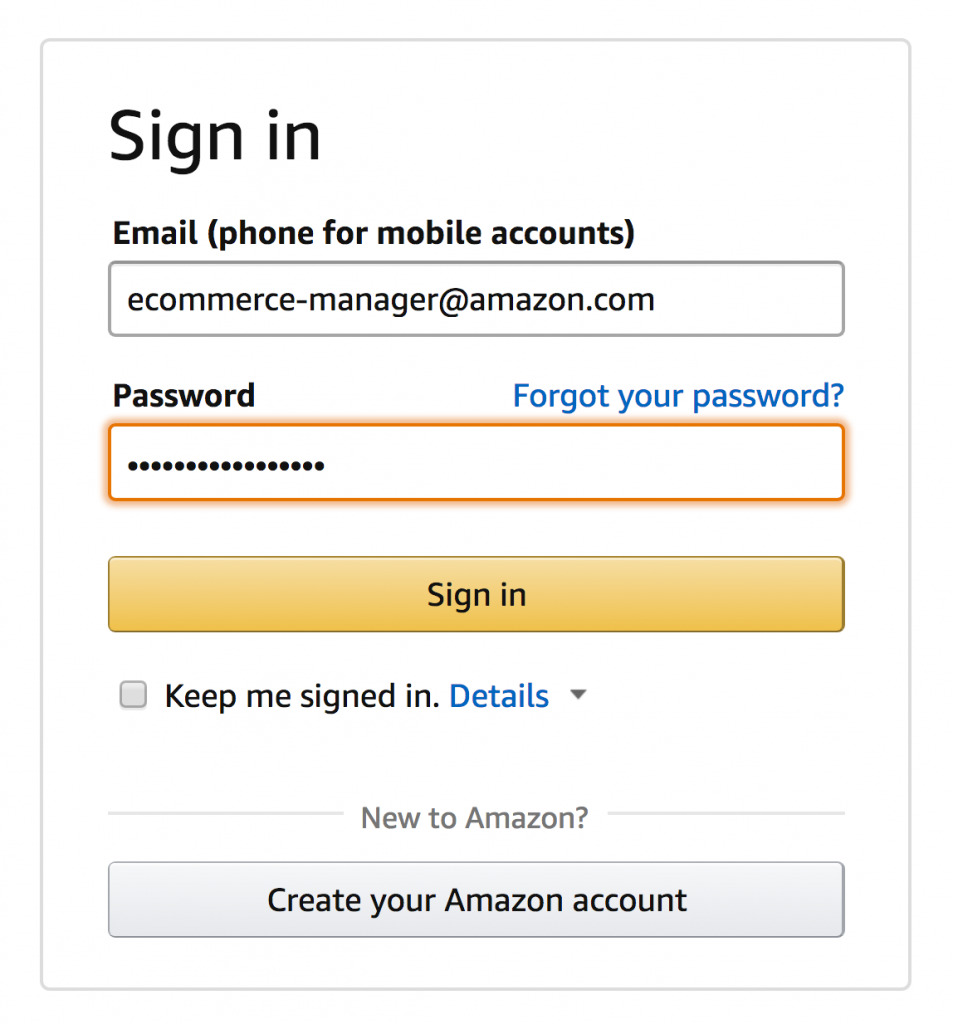
To avoid sending your customers to your competitors, we advise you to test your web form in order to make sure they are working properly. internetVista also allows you to monitor pages requiring an authentication.
💡 Note: It’s also possible to simulate the “account creation” process.
🔎 URL(s) to monitor: mywebsite.com/signin – mywebsite.com/register
Bonus: Optimize your conversion funnel with a transaction monitoring
Type of monitoring: Web scenarios 🎥
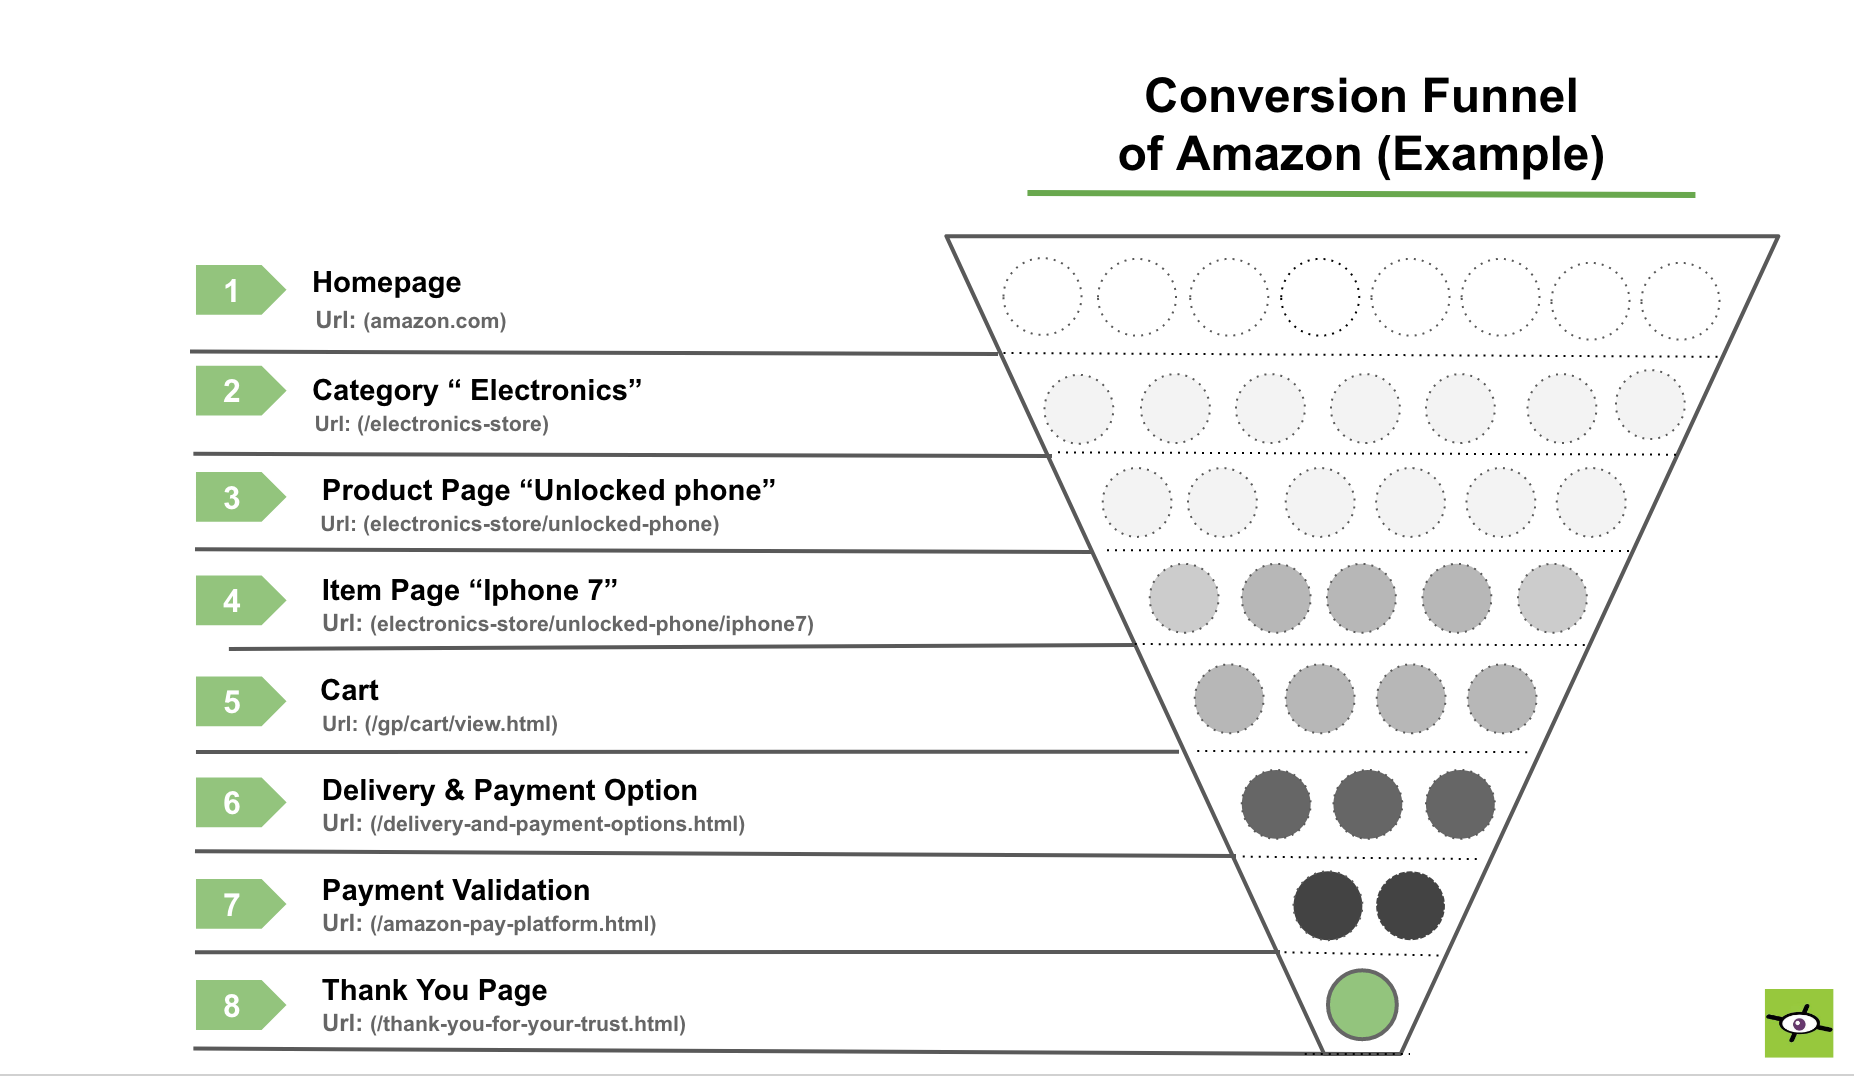
Whether you sell clothes or high-tech products, all of your customers have to go through key steps before proceeding to checkout. That’s what we call the “conversion funnel”.
In general, this looks like this:
- Homepage
- Category page
- Product Page
- Shopping cart
- Delivery & Payment option
- External payment gateway
- Order confirmation page
You can actually check your conversion funnel directly in Google Analytics.
Location: Conversions > Goals > Funnel Visualization
This is an example of what a typical funnel looks like on Amazon’s website
If the funnel optimization is so crucial, it’s because the amount of visitors is shrinking at every step!
To maximize your conversion rate, we advise you to set-up a monitoring based on a specific funnel taken by your visitors by using the transaction monitoring feature.
Here’s how it works:
Based on scenario that you’ve previously defined, our monitoring will check if your buyer’s journey is working smoothly and correctly. If one step of the funnel is detected on error, you’ll be directly alerted via email, SMS, …
This monitoring helps e-commerce manager to quickly evaluate the uptime rate and the load time for every step of the funnel. In short, you make sure to keep the user’s experience safe :).
⚠ Note: You need to know how to write scripts in XML language. You have the choice between doing it by yourself or contact the support team to get some help.
Wrapping it all up:
Insure the success of your e-commerce and monitor your:
- Homepage with a content verification
- Landing pages & product pages
- Checkout process
- Database used for the “site search” function
- Sign In & register forms
- [Bonus] Conversion funnel with a web scenario
What’s the performance for the e-commerce in 2017 ?
Our mission is simple: “Going towards a faster & more reliable web” 🚀
Like every year, we’ll monitor the web performance of the major online retailers during the holiday season. This time, we’ll include the major players from Belgium, France and the USA.
A first report will be published on Wednesday 29/11/17 just right after Cyber Monday. Another post will be done on our blog in early January with a complete reports combining the performance for the cyber week and Christmas. Click on this link to view the entire list of websites under monitoring.
📅 Time: 20/11/17 to 31/01/18
⏱ Check frequency: 1 minute
🌏 Monitored from: Amsterdam, Brussels, Dallas, Lausanne, London, Montréal, Munich, Roubaix.
🔎 Page monitored: Homepage
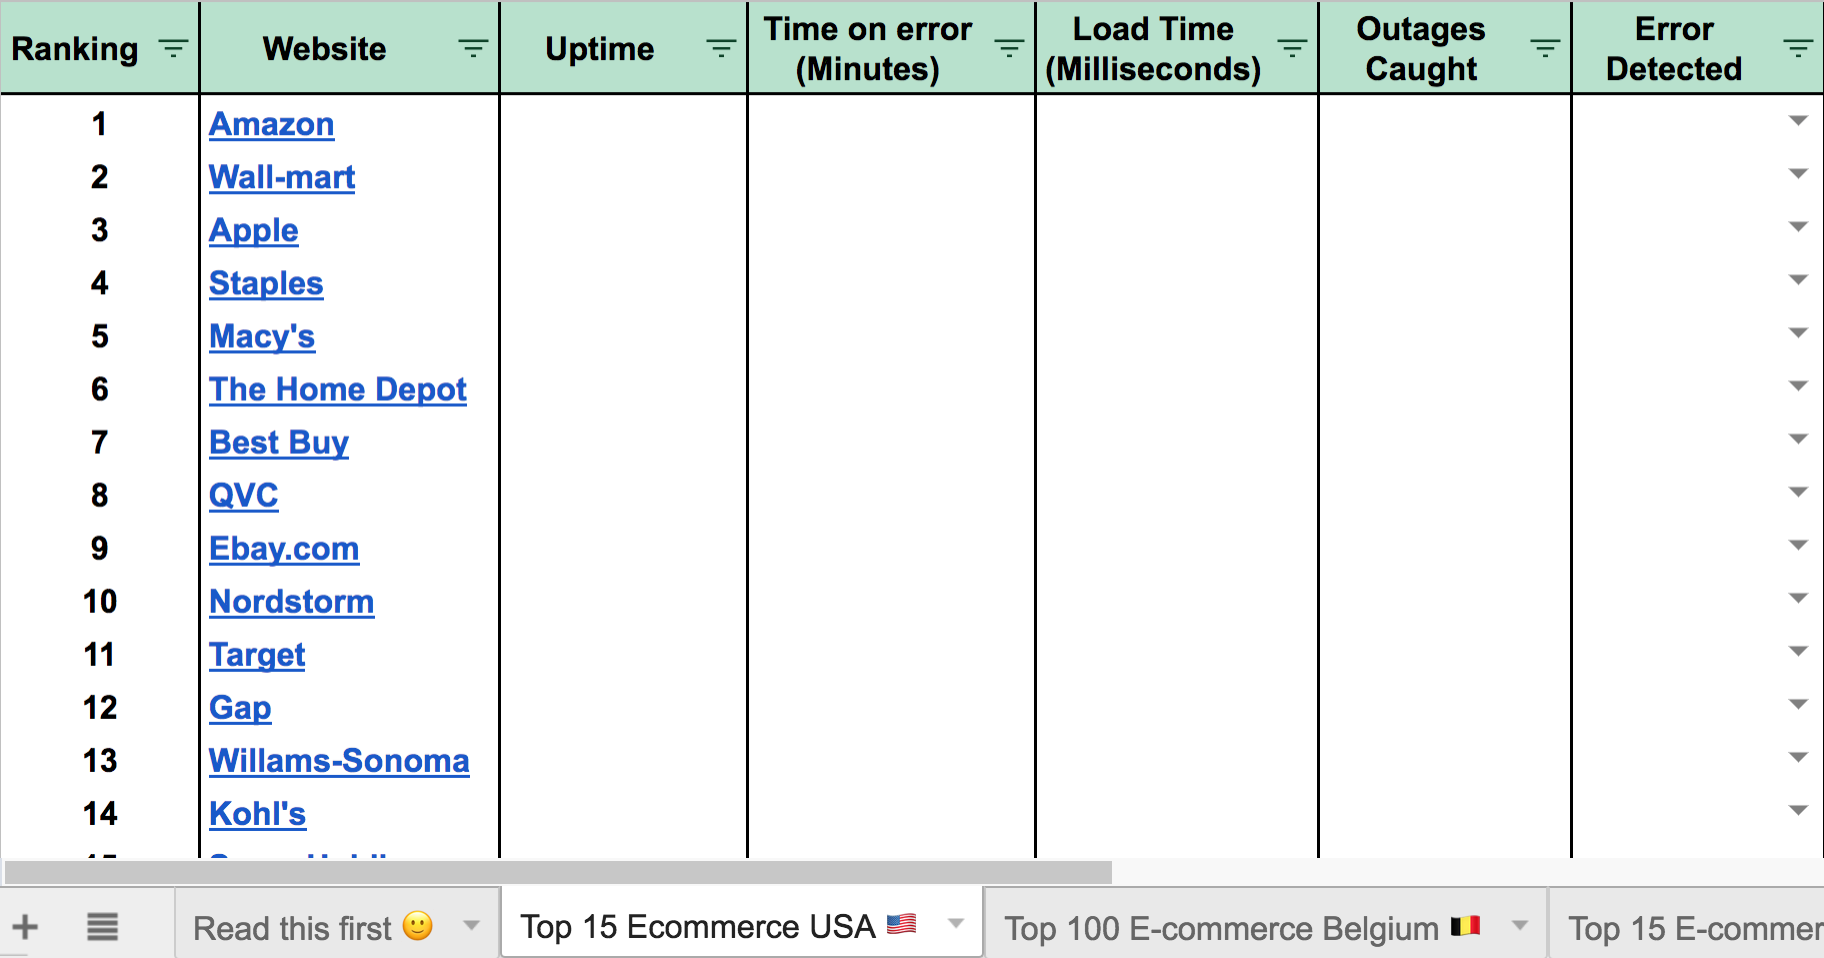
[alert type=”success” icon-size=”hide-icon”] Check the spreadsheet including the most visited e-commerce sites in Belgium, France and USA.[/alert]
Is your online store ready ?
A website breakdown can be very expensive for your online business. Especially if an outage occurs during major events such as the holiday season, where the traffic reaches its highest peak.
Too often, downtime happens when we expect the least… and at the baddest time.
By taking and applying the tips previously mentioned, you’ll avoid to be caught unprepared and you’ll secure your online revenues.
Stop waiting until it’s too late, monitor your e-commerce reliability now! (And it’s FREE during 30 days)
[alert type=”success” icon-size=”hide-icon”]Are you on Facebook? Join our community then! [/alert]
