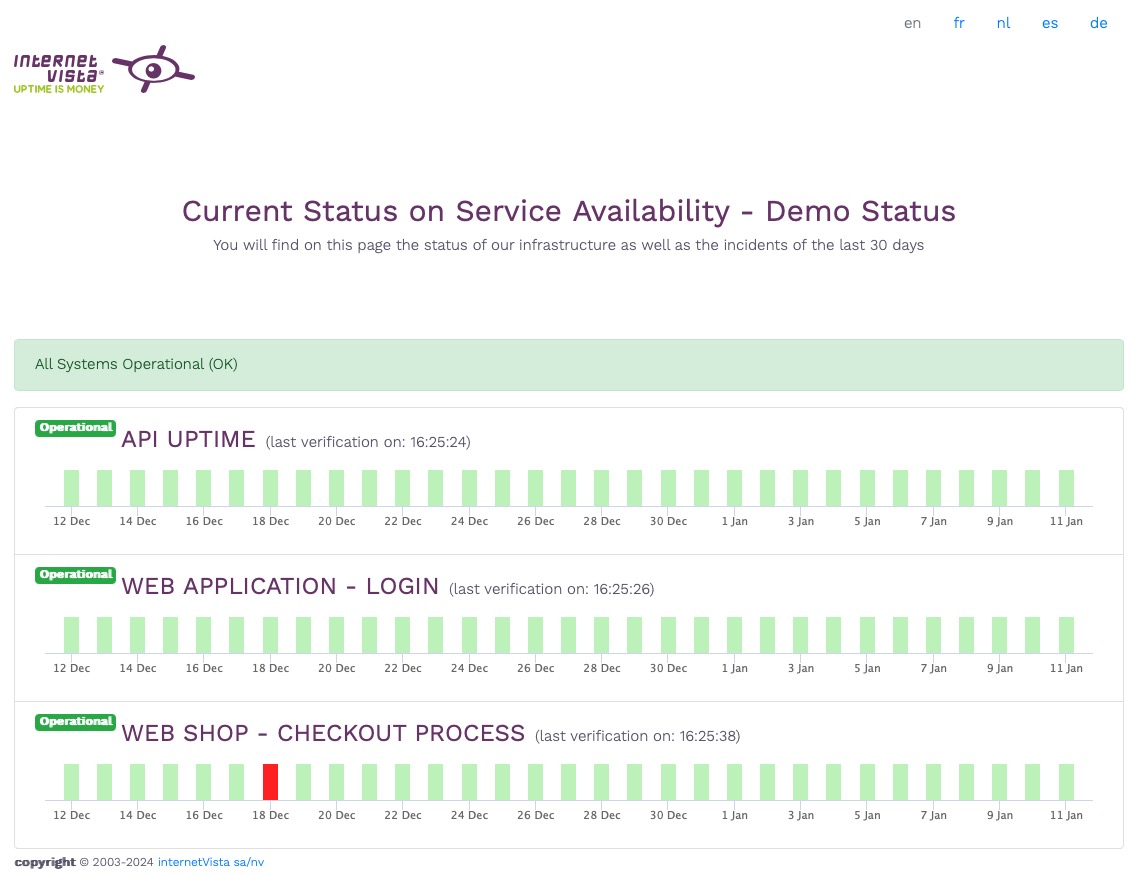
We are living in an age where digital is of paramount importance, requiring you to prove the quality of your services to your customers. internetVista has therefore come up with a page that allows you to publicly display the status of your monitored web services. This functionality came out as among the most important during our survey and interviews with our users.
The idea is clearly to provide you with a URL that, at a glance, allows you to visualise the status of your monitored Internet services. This page can represent all your monitoring or just part of it. You can easily share this URL with your team, management, customers or partners.

When you initialise your monitoring subscription, the system automatically creates a “default” status page. This page shows the availability data for all your applications for the last 30 days.
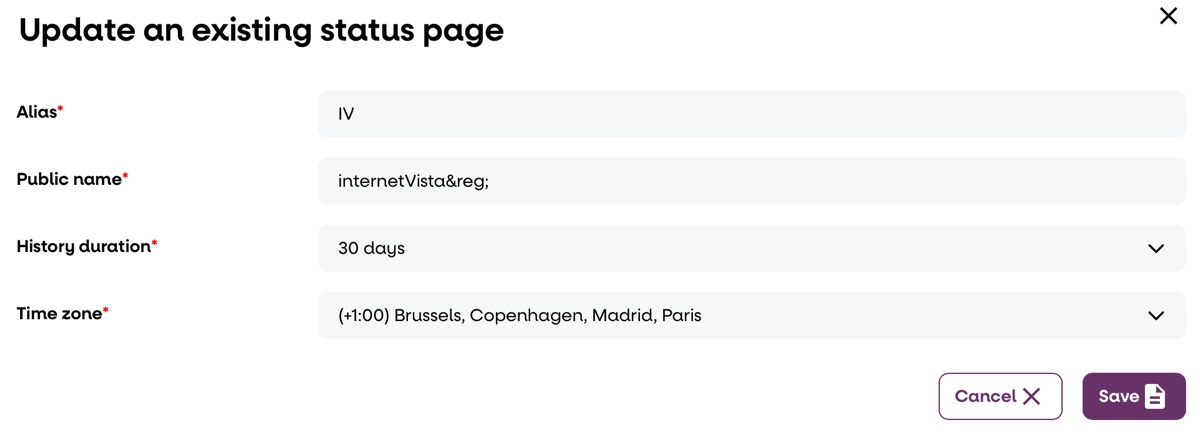
You can define as many status pages as you like, and for each page you can customise its name, the period you want to display, the time zone of the data and the applications concerned by this status page.

Pour accéder à la page de personnalisation : Login > Configuration > Pages de statut
For each status page, you can define which applications you want to display (link with applications), as well as preview the status page or copy the link to the clipboard. These actions are available via the context menu:

This page, which can be configured in your internetVista space, allows you to display the current status of your services and also offers a holistic view of the last 30 days, along with any incidents.
So what are you waiting for? Demonstrate the quality of your APIs, your websites, your SaaS or your e-commerce site!
